Profiling
启用Profiling
weroll集成了一种简单的程序性能监控手段, 可以统计WebApp和APIServer中每一个API请求和页面请求的执行性能状况.
开发者只需要在setting.js中设置好Redis连接配置, 然后在启动进程时添加 -profiling 参数即可开启性能监控, 如:
$ node main.js -env=prod -profiling
性能监控开启后, weroll默认将会每3秒一次把统计信息写入到Redis里, 开发者也可以定义这个时间周期:
/* ./server/config/%ENV%/setting.js */
module.exports = {
    ....
    profiling: {
        duration:1000    //更改为每秒写一次统计信息
    }
    ...
}
查看和清理Profiling
目前weroll的性能监控针对API和页面请求提供以下的信息统计:
- total所有请求总次数
- count单个请求发生次数
- avg平均请求处理时间, 单位: 毫秒
- min请求最短处理时间, 单位: 毫秒
- max请求最长处理时间, 单位: 毫秒
以website模板项目为例, 开启性能监控后, 在项目目录下执行profiling脚本可以看到性能监控信息:
$ node exec.js profiling default
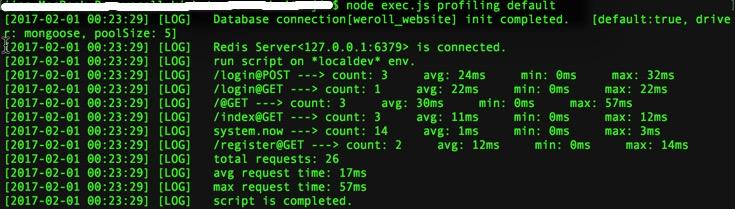
截图中, login表单提交POST请求发生3次, 平均耗时24毫秒, 最小耗时0毫秒, 最大耗时32毫秒;
system.now这个API被调用了14次, 平均耗时1毫秒;
总共发生了26次请求, 平均耗时17毫秒, 最大耗时57毫秒
执行脚本时使用clean参数可以清理性能监控信息:
$ node exec.js profiling default clean
执行脚本请参考Tools文档.